TCO and direct purchasing: why total cost of ownership remains underused at the BOM level

Matthieu Benat
•
TCO and direct purchasing: why total cost of ownership remains underused at the BOM level
Matthieu Benat
•
TCO and direct purchasing: why total cost of ownership remains underused at the BOM level
Matthieu Benat
•
Introduction
Every procurement team knows the theory: don't just look at price, look at total cost. In practice, most direct materials sourcing still optimizes the wrong number. A buyer receives three quotes, picks the lowest unit price, logs the saving against budget, and moves on. The real cost of that decision shows up later — in rework, in expediting fees, in unplanned production stoppages, and in the next RFQ cycle starting from scratch with the same data gaps as the last one.
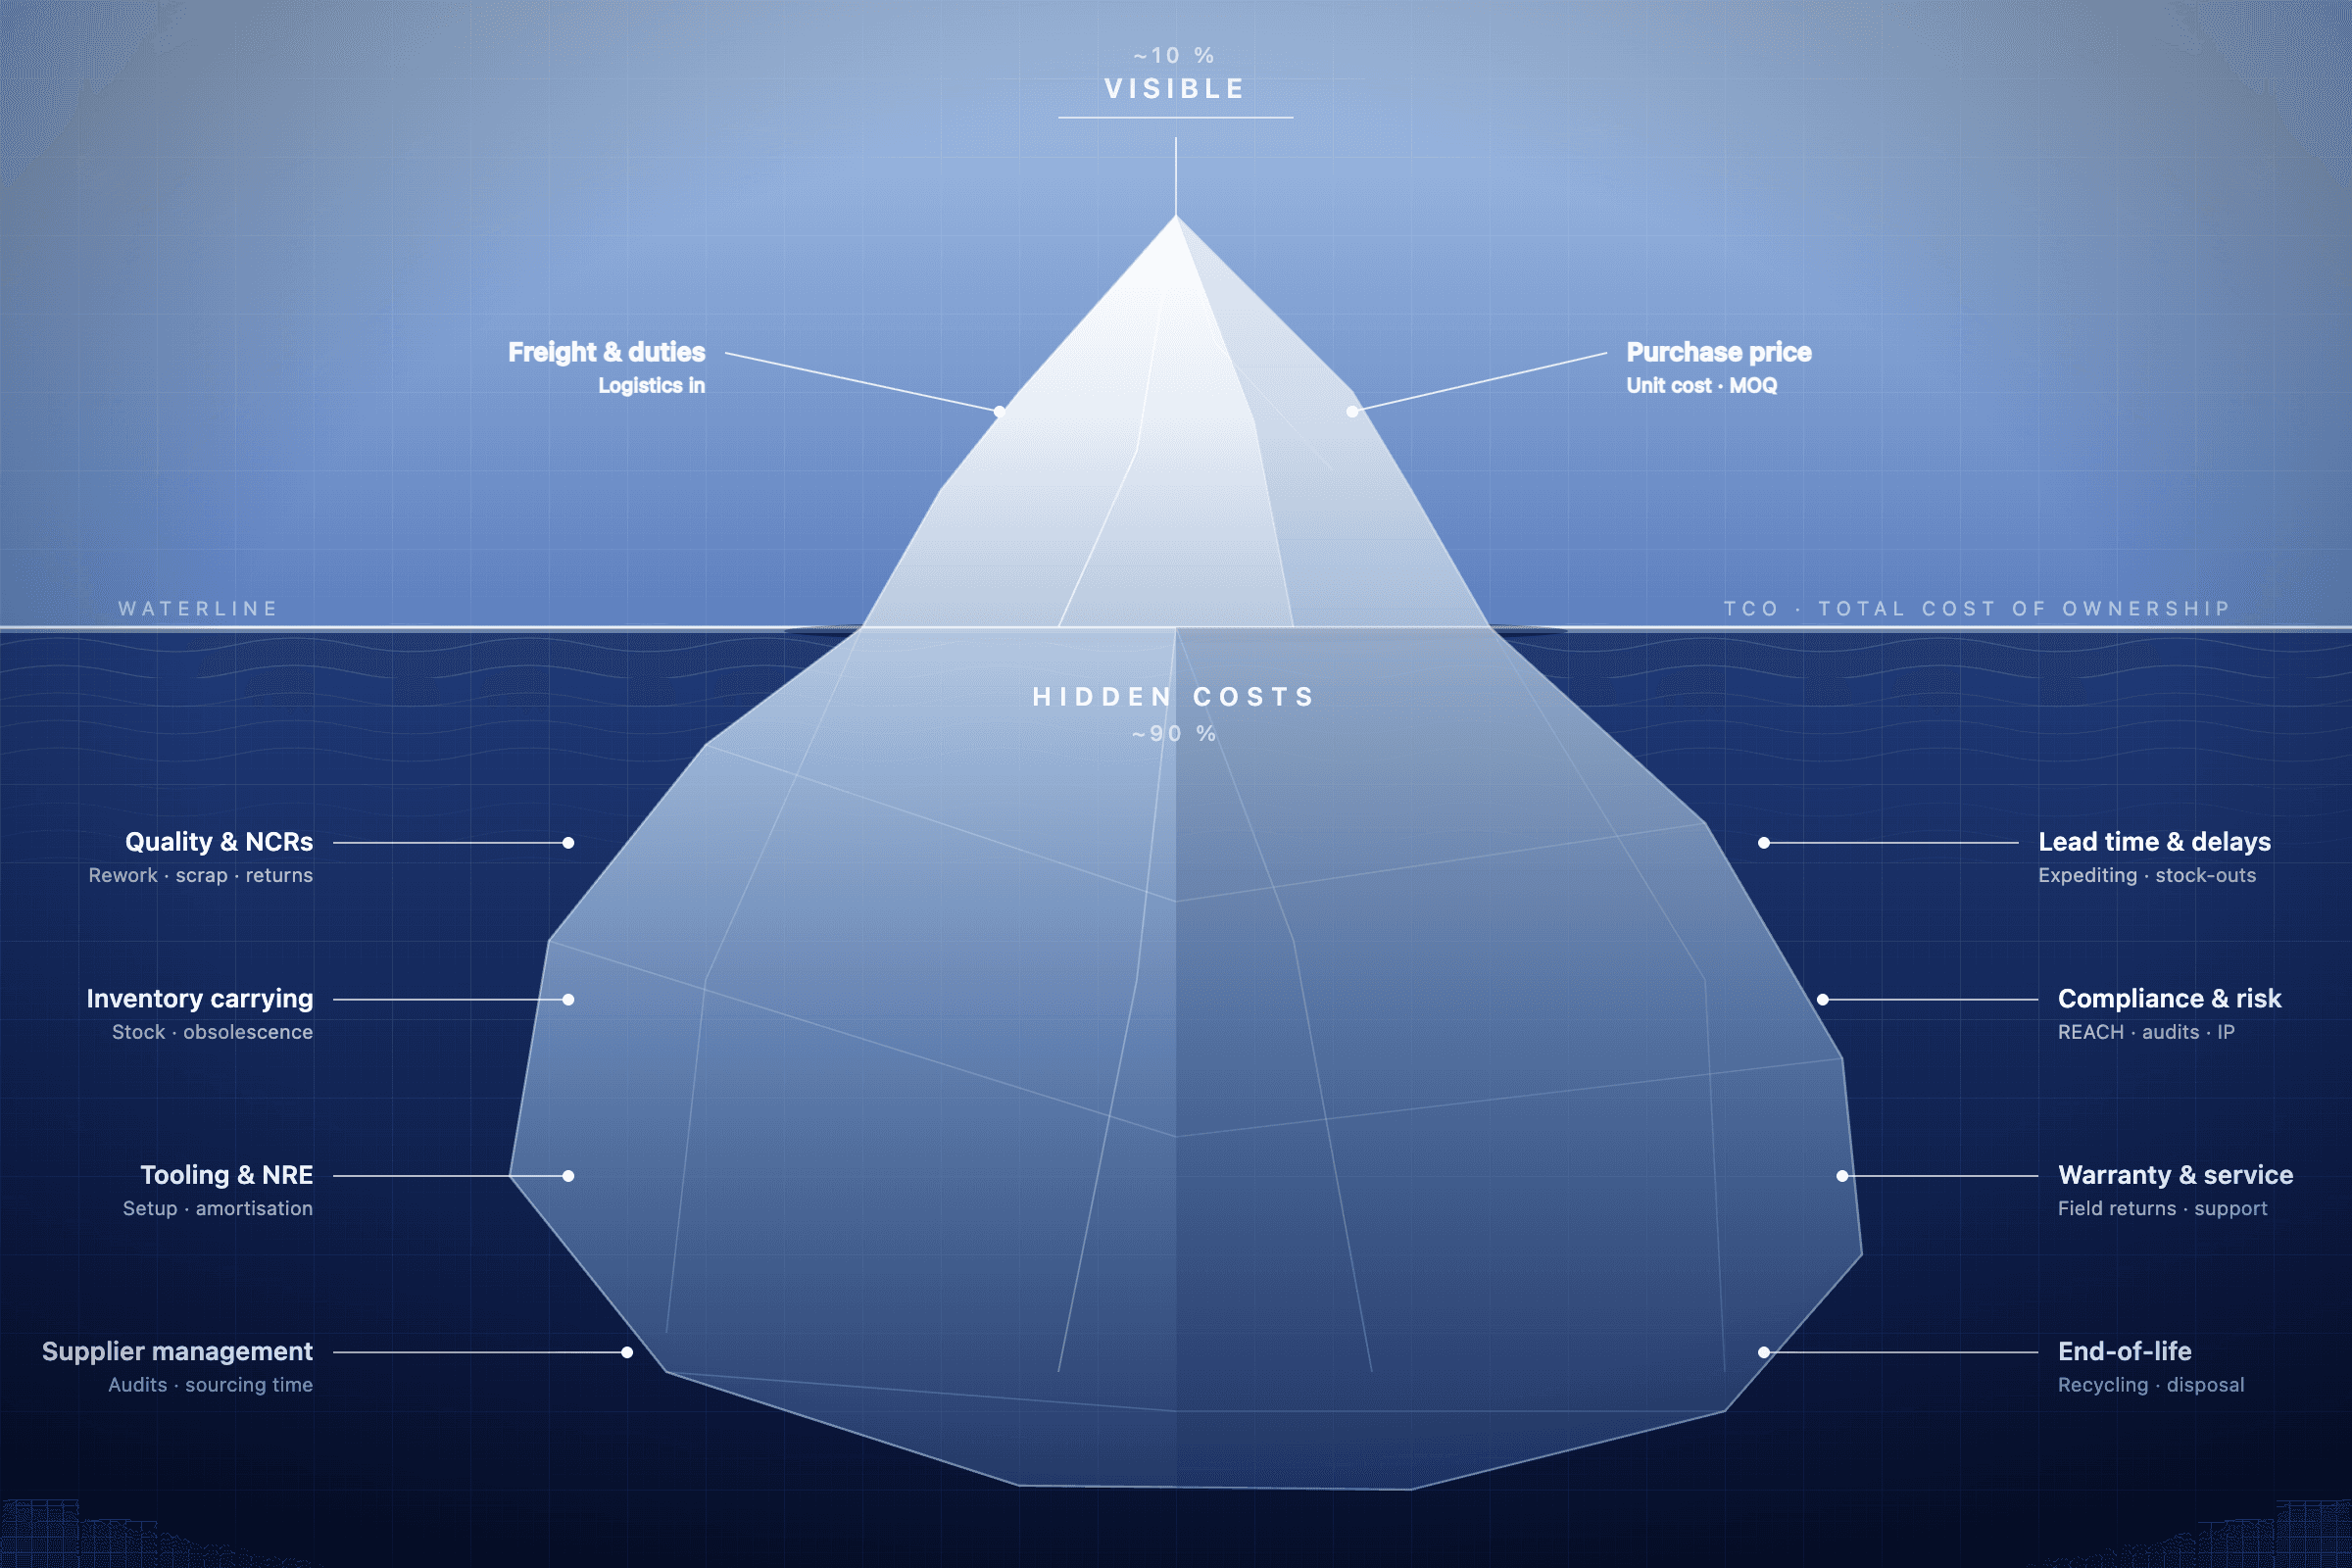
Total Cost of Ownership (TCO) is not a new concept. What is new, and still largely underdeveloped, is its application to direct materials procurement at the component and BOM level. TCO has been rigorously applied to capital equipment, software, and IT infrastructure. Its logic has been proven in those contexts. But the same hidden cost structures exist in direct materials sourcing, and the gap between quoted unit price and actual total cost can be just as wide, sometimes wider, because volume multiplies every decision across thousands of BOM line items.
The Gap Between Quoted Price and Actual Cost
The standard objection to TCO in direct materials is that components are not assets. You buy them, consume them, and move on. There is no maintenance phase, no disposal cost. The lifecycle is short.
That objection confuses the component lifecycle with the procurement cycle lifecycle. The costs that TCO surfaces in direct materials are not post-purchase operating costs. They are the costs that accumulate around every sourcing decision: the processing cost of running RFQs, the quality costs absorbed when a low-cost supplier delivers out-of-spec parts, the inventory costs tied to unreliable lead times, the supply disruption costs of single-source exposure, and the opportunity cost of manual repricing work at every cycle because historical pricing data was never structured.
McKinsey identifies these precisely as the "hidden value pools" of procurement: price dispersion across suppliers, specification drift, freight premiums, excess inventory, and payment-term leakage. These are the real problems to attack and they are systematically invisible in a unit price comparison.
The ISM makes the same point directly: in sourcing, lead times, minimum order quantities, and risk buffers significantly affect inventory carrying costs and obsolescence risk, and these variables play a more significant role in TCO than the initial purchase price.
What Unit Price Comparisons Miss
Transaction costs
Direct materials procurement is operationally intensive. Sending RFQs, chasing supplier responses, parsing quotes received in PDF or email format, normalizing data into comparable formats, building allocation scenarios in spreadsheets — this work has a real cost measured in buyer hours. It typically doesn't appear in a cost-per-component calculation, but it determines how many line items get properly benchmarked each cycle and how much negotiating leverage buyers actually exercise.
When buyers spend most of their time processing data rather than analyzing it, the practical consequence is that fewer sourcing decisions get TCO treatment. The components that get properly scrutinized are the high-spend items buyers already know to watch. The long tail which can account for a significant share of BOM cost when aggregated gets sourced on price alone, or not re-sourced at all, because there isn't time.
Quality costs
A supplier offering a 15% lower unit price is a worse option if unexpected quality failures arrive with the delivery. Rework costs, inspection overhead, and production downtime can erase the apparent saving — and then some. These costs are typically not attributed back to the sourcing decision that caused them: they appear in the production account, not in the supplier comparison.
McKinsey documents this mechanism precisely: digitally monitoring supplier performance KPIs can recover up to 5% in value leakage through better discussions on quality and on-time delivery. That is 5% recoverable value that simply does not exist in a unit price comparison because supplier performance is not part of it.
Inventory and lead time costs
The unit price on a quote is quoted for a delivery date. What it doesn't tell you is what happens to your inventory position if that delivery is two weeks late, or if the minimum order quantity forces you to carry eight weeks of stock rather than four.
These costs are real and they compound at BOM scale. Excess inventory ties up working capital. Buffer stock built to hedge against supplier unreliability has a financing cost. Lead time volatility forces safety stock decisions that affect cash flow across every component category simultaneously. None of this is visible in a unit price comparison.
For direct materials specifically, the inventory dimension of TCO is often underweighted because it sits at the boundary between procurement and finance procurement manages the sourcing decision, finance manages the working capital and that conversation rarely happens at the component level.
Supply disruption costs
Single-source components are the highest-risk line items in any BOM, and also the ones where the unit price comparison is most misleading. The quoted price reflects a world where delivery happens as planned. TCO reflects a world where it sometimes doesn't.
McKinsey flags this directly in its analysis of procurement dashboards: the impact of single sourcing on total spend is one of the key indicators teams should track as a priority but that most don't, for lack of structured data. A component with no qualified alternate, a supplier concentrated in a single geography, and a 14-week lead time has a fundamentally different disruption cost profile from a commodity part available from three distributors with a 2-week lead time even if both carry the same unit price.
Why TCO Remains Underused in Direct Materials
Gartner is explicit on this point: TCO is a resource-intensive methodology, requiring procurement organizations to invest significantly in strategic skills, stakeholder engagement, and deep supplier management. Teams don't apply it systematically not because they don't understand its value, but because organizational silos and financial reporting structures make it difficult to capture and validate savings beyond unit price.
The case for TCO in capital equipment procurement is structurally simpler. One machine, a defined lifecycle, a finite set of cost categories to model. Procurement teams do it because the amounts are large enough to justify the analysis effort and structured enough to make it tractable.
Direct materials sourcing at BOM scale is an entirely different order of complexity. An industrial manufacturer's BOM may have 500 to 2,000+ line items. Each line item has its own supplier set, its own quality profile, its own lead time distribution, its own inventory implications. A full TCO model at the component level, built manually in spreadsheets, would take longer to construct than the procurement cycle it is meant to inform.
This is why unit price comparisons persist in direct materials. It is not that buyers don't understand TCO theory. It is that the data infrastructure to apply it at BOM scale has not existed. The unit price on a supplier quote is available, structured, and immediate. Transaction costs, quality costs, inventory costs, and disruption costs are dispersed across email inboxes, ERP systems, spreadsheet tabs, and institutional memory. Assembling them into a single decision view requires more work than most procurement cycles allow.
The result is a systematic bias toward the wrong number. Decisions that should be made on total cost are made on unit price because unit price is the only data that's organized.
What Applying TCO to Direct Materials Actually Requires
TCO at BOM scale doesn't require building a full lifecycle model for every component. It requires making the hidden costs visible in the same place as the quoted price so that the trade-offs that exist in reality also exist in the data buyers use to make decisions.
Concretely, that means three things:
Structured pricing history across cycles. The single biggest driver of TCO invisibility in direct materials is that pricing data is ephemeral. Quotes arrive, get reviewed, get acted on, and then disappear into email archives. The next RFQ cycle starts without knowing what was paid last time, which suppliers came in high, or which components showed the largest price variance across the panel. McKinsey recommends extracting 12 to 24 months of purchase order and invoice data to build the cost baseline that makes savings verifiable without it, gains remain, in their words, "unverifiable accounting folklore."
Quality and delivery performance by supplier. Unit price comparisons are only comparable when supplier quality and reliability are equivalent. In practice they aren't, and the difference is quantifiable if the data is captured. Defect rates, on-time delivery performance, and lead time variance, mapped to specific suppliers and component categories, turn the unit price comparison into a cost-adjusted comparison where the real trade-off is visible.
Multi-constraint scenario modeling. TCO at BOM level is not a single number it is a function of allocation decisions across the supplier panel. Which components go to which supplier, at what quantities, under what lead time and MOQ constraints, determines the total cost picture. Modeling this manually across a 500-line BOM is not feasible. Doing it systematically, across all constraints simultaneously, is what converts TCO from a theoretical framework into an operational decision.
The Manufacturing Institute has documented that automakers applying lifecycle cost analysis to their supplier decisions achieved up to 25% reductions in TCO not by finding cheaper unit prices, but by making better decisions about which suppliers to use and under what terms. The same logic applies at the component level in direct materials.
What AI Changes Concretely
The constraint identified throughout this article is structural, not human: TCO is impractical manually at BOM scale. This is where AI enters not as a marketing argument, but as a precise answer to a data volume problem.
McKinsey estimates that AI tools applied to procurement can improve team productivity by 25 to 40%. For direct materials, that productivity translates into three concrete gains. First, automatic ingestion and normalization of supplier quotes freeing buyers from formatting work so they can focus on analysis. Second, the progressive accumulation of structured pricing history at every cycle, building up instead of disappearing into email archives. Third, multi-constraint modeling across the full BOM a combinatorial calculation that spreadsheets cannot solve beyond a few dozen line items.
McKinsey also documents tangible results from should-cost modeling in raw materials: a specialty chemicals manufacturer that developed this capability saved 13% on raw materials spend. The principle is identical in direct materials knowing what a component should cost before quotes arrive fundamentally changes the negotiating position.
The important nuance: AI does not calculate TCO for you. It makes available, at the right time and in the right place, the data that makes the calculation possible. The decision remains human. What changes is the quality of the information it rests on.
The Cost of Not Doing This
The default optimizing unit price in isolation has a consistent failure mode. Buyers select low-cost suppliers who underperform on quality or delivery. Those performance gaps generate costs that are never attributed back to the original sourcing decision. The next cycle, the same comparison is run against the same incomplete data, and the same decision gets made.
The cumulative effect is that direct materials costs are chronically higher than they need to be not because buyers are making irrational decisions, but because they are making rational decisions with incomplete information. The hidden costs are real; they are simply not visible at the moment the sourcing decision is made.
The case for TCO in direct materials is ultimately a case for making the real cost visible before the decision, not after. The analytical work required to do that at BOM scale has historically been prohibitive. That is the constraint that is changing and with it, the standard of what good direct materials procurement looks like.
Siembra builds AI-powered procurement intelligence for industrial manufacturers structured pricing history, supplier performance tracking, and multi-constraint BOM optimization.
Sources
McKinsey — The Hidden Source of Value: Procurement https://www.mckinsey.com/capabilities/operations/our-insights/now-is-the-time-for-procurement-to-lead-value-capture
McKinsey — Shifting the Dial in Procurement https://www.mckinsey.com/capabilities/operations/our-insights/shifting-the-dial-in-procurement
McKinsey — Transforming Procurement Functions for an AI-Driven World (2025) https://www.mckinsey.com/capabilities/operations/our-insights/transforming-procurement-functions-for-an-ai-driven-world
McKinsey — Use Procurement's Data to Power Your Performance https://www.mckinsey.com/capabilities/operations/our-insights/use-procurements-data-to-power-your-performance
ISM — Understanding Total Cost of Ownership in Procurement (2025) https://www.ism.ws/supply-chain/ownership-in-procurement/
Gartner — Embed Total Cost of Ownership in Procurement Teams to Optimize Value https://www.gartner.com/en/documents/5177463
Gartner — Use Total Cost of Ownership to Optimize Costs and Increase Savings https://www.gartner.com/en/documents/3847267
Manufacturing Institute — Automotive TCO findings (via ISM, 2025)
Introduction
Every procurement team knows the theory: don't just look at price, look at total cost. In practice, most direct materials sourcing still optimizes the wrong number. A buyer receives three quotes, picks the lowest unit price, logs the saving against budget, and moves on. The real cost of that decision shows up later — in rework, in expediting fees, in unplanned production stoppages, and in the next RFQ cycle starting from scratch with the same data gaps as the last one.
Total Cost of Ownership (TCO) is not a new concept. What is new, and still largely underdeveloped, is its application to direct materials procurement at the component and BOM level. TCO has been rigorously applied to capital equipment, software, and IT infrastructure. Its logic has been proven in those contexts. But the same hidden cost structures exist in direct materials sourcing, and the gap between quoted unit price and actual total cost can be just as wide, sometimes wider, because volume multiplies every decision across thousands of BOM line items.
The Gap Between Quoted Price and Actual Cost
The standard objection to TCO in direct materials is that components are not assets. You buy them, consume them, and move on. There is no maintenance phase, no disposal cost. The lifecycle is short.
That objection confuses the component lifecycle with the procurement cycle lifecycle. The costs that TCO surfaces in direct materials are not post-purchase operating costs. They are the costs that accumulate around every sourcing decision: the processing cost of running RFQs, the quality costs absorbed when a low-cost supplier delivers out-of-spec parts, the inventory costs tied to unreliable lead times, the supply disruption costs of single-source exposure, and the opportunity cost of manual repricing work at every cycle because historical pricing data was never structured.
McKinsey identifies these precisely as the "hidden value pools" of procurement: price dispersion across suppliers, specification drift, freight premiums, excess inventory, and payment-term leakage. These are the real problems to attack and they are systematically invisible in a unit price comparison.
The ISM makes the same point directly: in sourcing, lead times, minimum order quantities, and risk buffers significantly affect inventory carrying costs and obsolescence risk, and these variables play a more significant role in TCO than the initial purchase price.
What Unit Price Comparisons Miss
Transaction costs
Direct materials procurement is operationally intensive. Sending RFQs, chasing supplier responses, parsing quotes received in PDF or email format, normalizing data into comparable formats, building allocation scenarios in spreadsheets — this work has a real cost measured in buyer hours. It typically doesn't appear in a cost-per-component calculation, but it determines how many line items get properly benchmarked each cycle and how much negotiating leverage buyers actually exercise.
When buyers spend most of their time processing data rather than analyzing it, the practical consequence is that fewer sourcing decisions get TCO treatment. The components that get properly scrutinized are the high-spend items buyers already know to watch. The long tail which can account for a significant share of BOM cost when aggregated gets sourced on price alone, or not re-sourced at all, because there isn't time.
Quality costs
A supplier offering a 15% lower unit price is a worse option if unexpected quality failures arrive with the delivery. Rework costs, inspection overhead, and production downtime can erase the apparent saving — and then some. These costs are typically not attributed back to the sourcing decision that caused them: they appear in the production account, not in the supplier comparison.
McKinsey documents this mechanism precisely: digitally monitoring supplier performance KPIs can recover up to 5% in value leakage through better discussions on quality and on-time delivery. That is 5% recoverable value that simply does not exist in a unit price comparison because supplier performance is not part of it.
Inventory and lead time costs
The unit price on a quote is quoted for a delivery date. What it doesn't tell you is what happens to your inventory position if that delivery is two weeks late, or if the minimum order quantity forces you to carry eight weeks of stock rather than four.
These costs are real and they compound at BOM scale. Excess inventory ties up working capital. Buffer stock built to hedge against supplier unreliability has a financing cost. Lead time volatility forces safety stock decisions that affect cash flow across every component category simultaneously. None of this is visible in a unit price comparison.
For direct materials specifically, the inventory dimension of TCO is often underweighted because it sits at the boundary between procurement and finance procurement manages the sourcing decision, finance manages the working capital and that conversation rarely happens at the component level.
Supply disruption costs
Single-source components are the highest-risk line items in any BOM, and also the ones where the unit price comparison is most misleading. The quoted price reflects a world where delivery happens as planned. TCO reflects a world where it sometimes doesn't.
McKinsey flags this directly in its analysis of procurement dashboards: the impact of single sourcing on total spend is one of the key indicators teams should track as a priority but that most don't, for lack of structured data. A component with no qualified alternate, a supplier concentrated in a single geography, and a 14-week lead time has a fundamentally different disruption cost profile from a commodity part available from three distributors with a 2-week lead time even if both carry the same unit price.
Why TCO Remains Underused in Direct Materials
Gartner is explicit on this point: TCO is a resource-intensive methodology, requiring procurement organizations to invest significantly in strategic skills, stakeholder engagement, and deep supplier management. Teams don't apply it systematically not because they don't understand its value, but because organizational silos and financial reporting structures make it difficult to capture and validate savings beyond unit price.
The case for TCO in capital equipment procurement is structurally simpler. One machine, a defined lifecycle, a finite set of cost categories to model. Procurement teams do it because the amounts are large enough to justify the analysis effort and structured enough to make it tractable.
Direct materials sourcing at BOM scale is an entirely different order of complexity. An industrial manufacturer's BOM may have 500 to 2,000+ line items. Each line item has its own supplier set, its own quality profile, its own lead time distribution, its own inventory implications. A full TCO model at the component level, built manually in spreadsheets, would take longer to construct than the procurement cycle it is meant to inform.
This is why unit price comparisons persist in direct materials. It is not that buyers don't understand TCO theory. It is that the data infrastructure to apply it at BOM scale has not existed. The unit price on a supplier quote is available, structured, and immediate. Transaction costs, quality costs, inventory costs, and disruption costs are dispersed across email inboxes, ERP systems, spreadsheet tabs, and institutional memory. Assembling them into a single decision view requires more work than most procurement cycles allow.
The result is a systematic bias toward the wrong number. Decisions that should be made on total cost are made on unit price because unit price is the only data that's organized.
What Applying TCO to Direct Materials Actually Requires
TCO at BOM scale doesn't require building a full lifecycle model for every component. It requires making the hidden costs visible in the same place as the quoted price so that the trade-offs that exist in reality also exist in the data buyers use to make decisions.
Concretely, that means three things:
Structured pricing history across cycles. The single biggest driver of TCO invisibility in direct materials is that pricing data is ephemeral. Quotes arrive, get reviewed, get acted on, and then disappear into email archives. The next RFQ cycle starts without knowing what was paid last time, which suppliers came in high, or which components showed the largest price variance across the panel. McKinsey recommends extracting 12 to 24 months of purchase order and invoice data to build the cost baseline that makes savings verifiable without it, gains remain, in their words, "unverifiable accounting folklore."
Quality and delivery performance by supplier. Unit price comparisons are only comparable when supplier quality and reliability are equivalent. In practice they aren't, and the difference is quantifiable if the data is captured. Defect rates, on-time delivery performance, and lead time variance, mapped to specific suppliers and component categories, turn the unit price comparison into a cost-adjusted comparison where the real trade-off is visible.
Multi-constraint scenario modeling. TCO at BOM level is not a single number it is a function of allocation decisions across the supplier panel. Which components go to which supplier, at what quantities, under what lead time and MOQ constraints, determines the total cost picture. Modeling this manually across a 500-line BOM is not feasible. Doing it systematically, across all constraints simultaneously, is what converts TCO from a theoretical framework into an operational decision.
The Manufacturing Institute has documented that automakers applying lifecycle cost analysis to their supplier decisions achieved up to 25% reductions in TCO not by finding cheaper unit prices, but by making better decisions about which suppliers to use and under what terms. The same logic applies at the component level in direct materials.
What AI Changes Concretely
The constraint identified throughout this article is structural, not human: TCO is impractical manually at BOM scale. This is where AI enters not as a marketing argument, but as a precise answer to a data volume problem.
McKinsey estimates that AI tools applied to procurement can improve team productivity by 25 to 40%. For direct materials, that productivity translates into three concrete gains. First, automatic ingestion and normalization of supplier quotes freeing buyers from formatting work so they can focus on analysis. Second, the progressive accumulation of structured pricing history at every cycle, building up instead of disappearing into email archives. Third, multi-constraint modeling across the full BOM a combinatorial calculation that spreadsheets cannot solve beyond a few dozen line items.
McKinsey also documents tangible results from should-cost modeling in raw materials: a specialty chemicals manufacturer that developed this capability saved 13% on raw materials spend. The principle is identical in direct materials knowing what a component should cost before quotes arrive fundamentally changes the negotiating position.
The important nuance: AI does not calculate TCO for you. It makes available, at the right time and in the right place, the data that makes the calculation possible. The decision remains human. What changes is the quality of the information it rests on.
The Cost of Not Doing This
The default optimizing unit price in isolation has a consistent failure mode. Buyers select low-cost suppliers who underperform on quality or delivery. Those performance gaps generate costs that are never attributed back to the original sourcing decision. The next cycle, the same comparison is run against the same incomplete data, and the same decision gets made.
The cumulative effect is that direct materials costs are chronically higher than they need to be not because buyers are making irrational decisions, but because they are making rational decisions with incomplete information. The hidden costs are real; they are simply not visible at the moment the sourcing decision is made.
The case for TCO in direct materials is ultimately a case for making the real cost visible before the decision, not after. The analytical work required to do that at BOM scale has historically been prohibitive. That is the constraint that is changing and with it, the standard of what good direct materials procurement looks like.
Siembra builds AI-powered procurement intelligence for industrial manufacturers structured pricing history, supplier performance tracking, and multi-constraint BOM optimization.
Sources
McKinsey — The Hidden Source of Value: Procurement https://www.mckinsey.com/capabilities/operations/our-insights/now-is-the-time-for-procurement-to-lead-value-capture
McKinsey — Shifting the Dial in Procurement https://www.mckinsey.com/capabilities/operations/our-insights/shifting-the-dial-in-procurement
McKinsey — Transforming Procurement Functions for an AI-Driven World (2025) https://www.mckinsey.com/capabilities/operations/our-insights/transforming-procurement-functions-for-an-ai-driven-world
McKinsey — Use Procurement's Data to Power Your Performance https://www.mckinsey.com/capabilities/operations/our-insights/use-procurements-data-to-power-your-performance
ISM — Understanding Total Cost of Ownership in Procurement (2025) https://www.ism.ws/supply-chain/ownership-in-procurement/
Gartner — Embed Total Cost of Ownership in Procurement Teams to Optimize Value https://www.gartner.com/en/documents/5177463
Gartner — Use Total Cost of Ownership to Optimize Costs and Increase Savings https://www.gartner.com/en/documents/3847267
Manufacturing Institute — Automotive TCO findings (via ISM, 2025)
Introduction
Every procurement team knows the theory: don't just look at price, look at total cost. In practice, most direct materials sourcing still optimizes the wrong number. A buyer receives three quotes, picks the lowest unit price, logs the saving against budget, and moves on. The real cost of that decision shows up later — in rework, in expediting fees, in unplanned production stoppages, and in the next RFQ cycle starting from scratch with the same data gaps as the last one.
Total Cost of Ownership (TCO) is not a new concept. What is new, and still largely underdeveloped, is its application to direct materials procurement at the component and BOM level. TCO has been rigorously applied to capital equipment, software, and IT infrastructure. Its logic has been proven in those contexts. But the same hidden cost structures exist in direct materials sourcing, and the gap between quoted unit price and actual total cost can be just as wide, sometimes wider, because volume multiplies every decision across thousands of BOM line items.
The Gap Between Quoted Price and Actual Cost
The standard objection to TCO in direct materials is that components are not assets. You buy them, consume them, and move on. There is no maintenance phase, no disposal cost. The lifecycle is short.
That objection confuses the component lifecycle with the procurement cycle lifecycle. The costs that TCO surfaces in direct materials are not post-purchase operating costs. They are the costs that accumulate around every sourcing decision: the processing cost of running RFQs, the quality costs absorbed when a low-cost supplier delivers out-of-spec parts, the inventory costs tied to unreliable lead times, the supply disruption costs of single-source exposure, and the opportunity cost of manual repricing work at every cycle because historical pricing data was never structured.
McKinsey identifies these precisely as the "hidden value pools" of procurement: price dispersion across suppliers, specification drift, freight premiums, excess inventory, and payment-term leakage. These are the real problems to attack and they are systematically invisible in a unit price comparison.
The ISM makes the same point directly: in sourcing, lead times, minimum order quantities, and risk buffers significantly affect inventory carrying costs and obsolescence risk, and these variables play a more significant role in TCO than the initial purchase price.
What Unit Price Comparisons Miss
Transaction costs
Direct materials procurement is operationally intensive. Sending RFQs, chasing supplier responses, parsing quotes received in PDF or email format, normalizing data into comparable formats, building allocation scenarios in spreadsheets — this work has a real cost measured in buyer hours. It typically doesn't appear in a cost-per-component calculation, but it determines how many line items get properly benchmarked each cycle and how much negotiating leverage buyers actually exercise.
When buyers spend most of their time processing data rather than analyzing it, the practical consequence is that fewer sourcing decisions get TCO treatment. The components that get properly scrutinized are the high-spend items buyers already know to watch. The long tail which can account for a significant share of BOM cost when aggregated gets sourced on price alone, or not re-sourced at all, because there isn't time.
Quality costs
A supplier offering a 15% lower unit price is a worse option if unexpected quality failures arrive with the delivery. Rework costs, inspection overhead, and production downtime can erase the apparent saving — and then some. These costs are typically not attributed back to the sourcing decision that caused them: they appear in the production account, not in the supplier comparison.
McKinsey documents this mechanism precisely: digitally monitoring supplier performance KPIs can recover up to 5% in value leakage through better discussions on quality and on-time delivery. That is 5% recoverable value that simply does not exist in a unit price comparison because supplier performance is not part of it.
Inventory and lead time costs
The unit price on a quote is quoted for a delivery date. What it doesn't tell you is what happens to your inventory position if that delivery is two weeks late, or if the minimum order quantity forces you to carry eight weeks of stock rather than four.
These costs are real and they compound at BOM scale. Excess inventory ties up working capital. Buffer stock built to hedge against supplier unreliability has a financing cost. Lead time volatility forces safety stock decisions that affect cash flow across every component category simultaneously. None of this is visible in a unit price comparison.
For direct materials specifically, the inventory dimension of TCO is often underweighted because it sits at the boundary between procurement and finance procurement manages the sourcing decision, finance manages the working capital and that conversation rarely happens at the component level.
Supply disruption costs
Single-source components are the highest-risk line items in any BOM, and also the ones where the unit price comparison is most misleading. The quoted price reflects a world where delivery happens as planned. TCO reflects a world where it sometimes doesn't.
McKinsey flags this directly in its analysis of procurement dashboards: the impact of single sourcing on total spend is one of the key indicators teams should track as a priority but that most don't, for lack of structured data. A component with no qualified alternate, a supplier concentrated in a single geography, and a 14-week lead time has a fundamentally different disruption cost profile from a commodity part available from three distributors with a 2-week lead time even if both carry the same unit price.
Why TCO Remains Underused in Direct Materials
Gartner is explicit on this point: TCO is a resource-intensive methodology, requiring procurement organizations to invest significantly in strategic skills, stakeholder engagement, and deep supplier management. Teams don't apply it systematically not because they don't understand its value, but because organizational silos and financial reporting structures make it difficult to capture and validate savings beyond unit price.
The case for TCO in capital equipment procurement is structurally simpler. One machine, a defined lifecycle, a finite set of cost categories to model. Procurement teams do it because the amounts are large enough to justify the analysis effort and structured enough to make it tractable.
Direct materials sourcing at BOM scale is an entirely different order of complexity. An industrial manufacturer's BOM may have 500 to 2,000+ line items. Each line item has its own supplier set, its own quality profile, its own lead time distribution, its own inventory implications. A full TCO model at the component level, built manually in spreadsheets, would take longer to construct than the procurement cycle it is meant to inform.
This is why unit price comparisons persist in direct materials. It is not that buyers don't understand TCO theory. It is that the data infrastructure to apply it at BOM scale has not existed. The unit price on a supplier quote is available, structured, and immediate. Transaction costs, quality costs, inventory costs, and disruption costs are dispersed across email inboxes, ERP systems, spreadsheet tabs, and institutional memory. Assembling them into a single decision view requires more work than most procurement cycles allow.
The result is a systematic bias toward the wrong number. Decisions that should be made on total cost are made on unit price because unit price is the only data that's organized.
What Applying TCO to Direct Materials Actually Requires
TCO at BOM scale doesn't require building a full lifecycle model for every component. It requires making the hidden costs visible in the same place as the quoted price so that the trade-offs that exist in reality also exist in the data buyers use to make decisions.
Concretely, that means three things:
Structured pricing history across cycles. The single biggest driver of TCO invisibility in direct materials is that pricing data is ephemeral. Quotes arrive, get reviewed, get acted on, and then disappear into email archives. The next RFQ cycle starts without knowing what was paid last time, which suppliers came in high, or which components showed the largest price variance across the panel. McKinsey recommends extracting 12 to 24 months of purchase order and invoice data to build the cost baseline that makes savings verifiable without it, gains remain, in their words, "unverifiable accounting folklore."
Quality and delivery performance by supplier. Unit price comparisons are only comparable when supplier quality and reliability are equivalent. In practice they aren't, and the difference is quantifiable if the data is captured. Defect rates, on-time delivery performance, and lead time variance, mapped to specific suppliers and component categories, turn the unit price comparison into a cost-adjusted comparison where the real trade-off is visible.
Multi-constraint scenario modeling. TCO at BOM level is not a single number it is a function of allocation decisions across the supplier panel. Which components go to which supplier, at what quantities, under what lead time and MOQ constraints, determines the total cost picture. Modeling this manually across a 500-line BOM is not feasible. Doing it systematically, across all constraints simultaneously, is what converts TCO from a theoretical framework into an operational decision.
The Manufacturing Institute has documented that automakers applying lifecycle cost analysis to their supplier decisions achieved up to 25% reductions in TCO not by finding cheaper unit prices, but by making better decisions about which suppliers to use and under what terms. The same logic applies at the component level in direct materials.
What AI Changes Concretely
The constraint identified throughout this article is structural, not human: TCO is impractical manually at BOM scale. This is where AI enters not as a marketing argument, but as a precise answer to a data volume problem.
McKinsey estimates that AI tools applied to procurement can improve team productivity by 25 to 40%. For direct materials, that productivity translates into three concrete gains. First, automatic ingestion and normalization of supplier quotes freeing buyers from formatting work so they can focus on analysis. Second, the progressive accumulation of structured pricing history at every cycle, building up instead of disappearing into email archives. Third, multi-constraint modeling across the full BOM a combinatorial calculation that spreadsheets cannot solve beyond a few dozen line items.
McKinsey also documents tangible results from should-cost modeling in raw materials: a specialty chemicals manufacturer that developed this capability saved 13% on raw materials spend. The principle is identical in direct materials knowing what a component should cost before quotes arrive fundamentally changes the negotiating position.
The important nuance: AI does not calculate TCO for you. It makes available, at the right time and in the right place, the data that makes the calculation possible. The decision remains human. What changes is the quality of the information it rests on.
The Cost of Not Doing This
The default optimizing unit price in isolation has a consistent failure mode. Buyers select low-cost suppliers who underperform on quality or delivery. Those performance gaps generate costs that are never attributed back to the original sourcing decision. The next cycle, the same comparison is run against the same incomplete data, and the same decision gets made.
The cumulative effect is that direct materials costs are chronically higher than they need to be not because buyers are making irrational decisions, but because they are making rational decisions with incomplete information. The hidden costs are real; they are simply not visible at the moment the sourcing decision is made.
The case for TCO in direct materials is ultimately a case for making the real cost visible before the decision, not after. The analytical work required to do that at BOM scale has historically been prohibitive. That is the constraint that is changing and with it, the standard of what good direct materials procurement looks like.
Siembra builds AI-powered procurement intelligence for industrial manufacturers structured pricing history, supplier performance tracking, and multi-constraint BOM optimization.
Sources
McKinsey — The Hidden Source of Value: Procurement https://www.mckinsey.com/capabilities/operations/our-insights/now-is-the-time-for-procurement-to-lead-value-capture
McKinsey — Shifting the Dial in Procurement https://www.mckinsey.com/capabilities/operations/our-insights/shifting-the-dial-in-procurement
McKinsey — Transforming Procurement Functions for an AI-Driven World (2025) https://www.mckinsey.com/capabilities/operations/our-insights/transforming-procurement-functions-for-an-ai-driven-world
McKinsey — Use Procurement's Data to Power Your Performance https://www.mckinsey.com/capabilities/operations/our-insights/use-procurements-data-to-power-your-performance
ISM — Understanding Total Cost of Ownership in Procurement (2025) https://www.ism.ws/supply-chain/ownership-in-procurement/
Gartner — Embed Total Cost of Ownership in Procurement Teams to Optimize Value https://www.gartner.com/en/documents/5177463
Gartner — Use Total Cost of Ownership to Optimize Costs and Increase Savings https://www.gartner.com/en/documents/3847267
Manufacturing Institute — Automotive TCO findings (via ISM, 2025)